The interfaces for different scripts provided by STATools are organized via menu (Figure 4) as follows:

Figure 3: Menu bar.
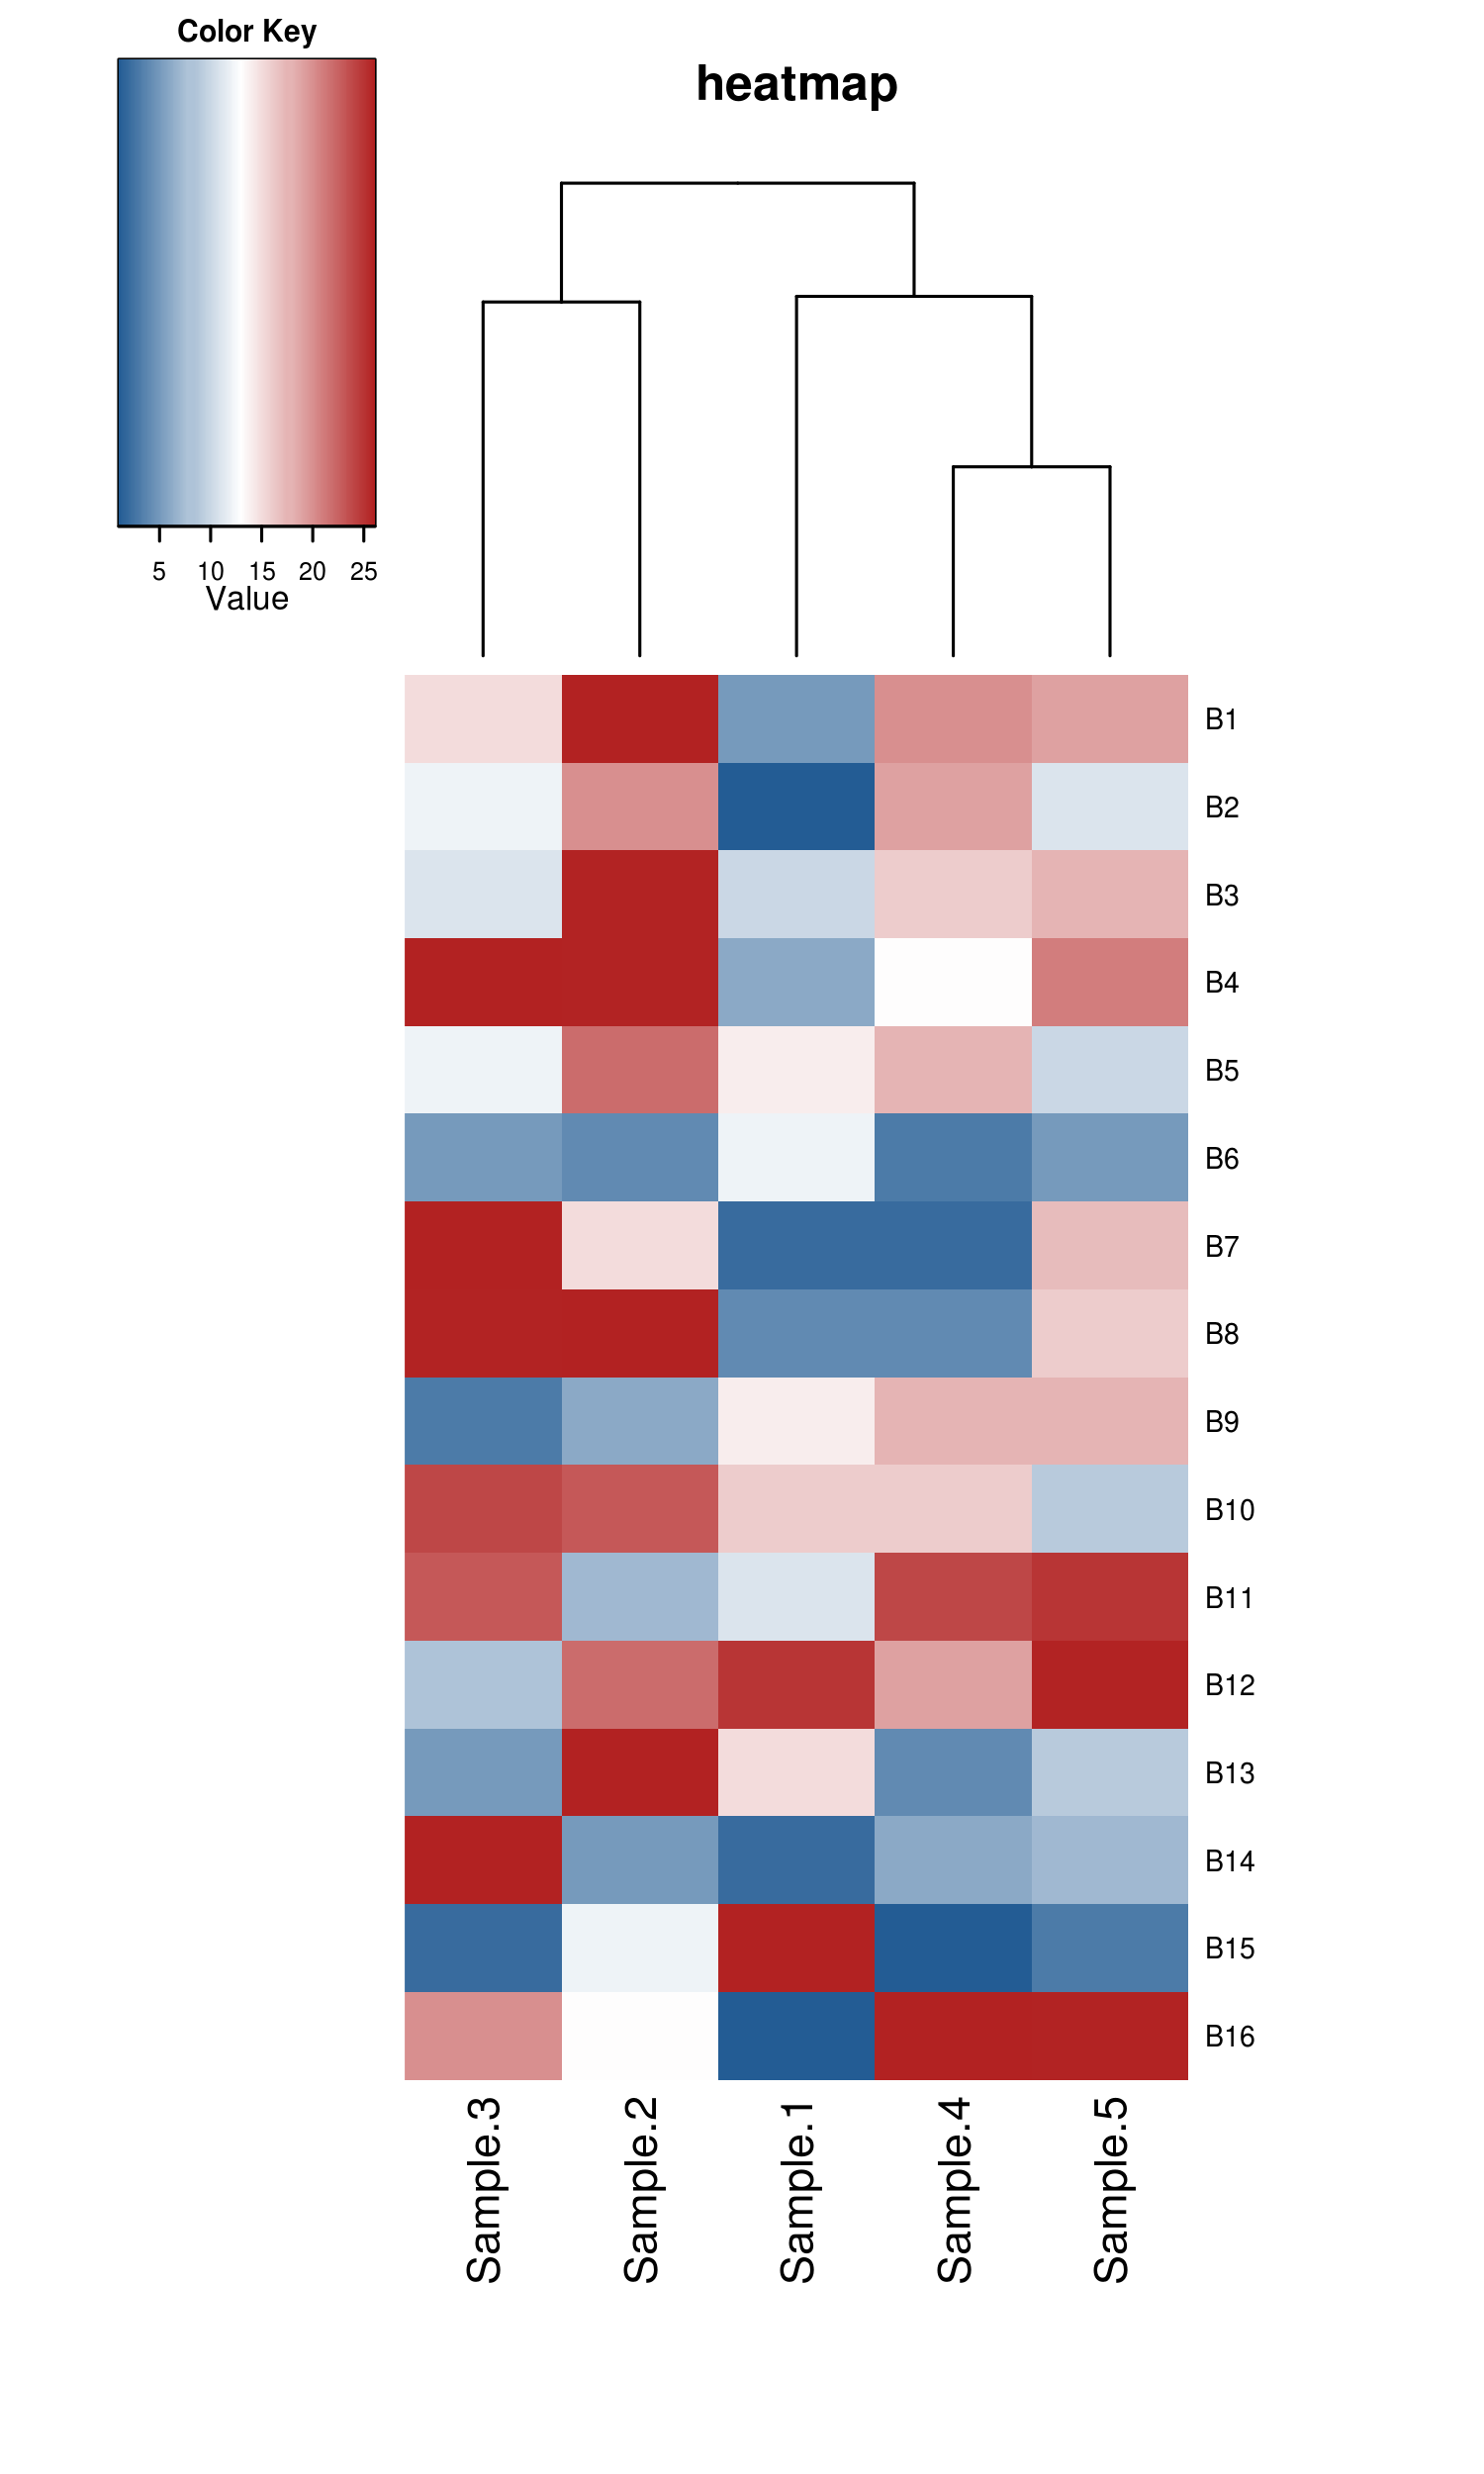
There follows an example of the typical usage to create a heatmap using a count file summarizing the logFold Change (logFC) values of distinct expressed genes (rows) in three different samples (columns). In constructing the heatmap we will apply colour breaks either based three defined quantiles (red, yellow and green) as well as clustering of the samples using the complete linkage method with Euclidean distance measure.
Take into account running in root mode to ensure a good performance of the application.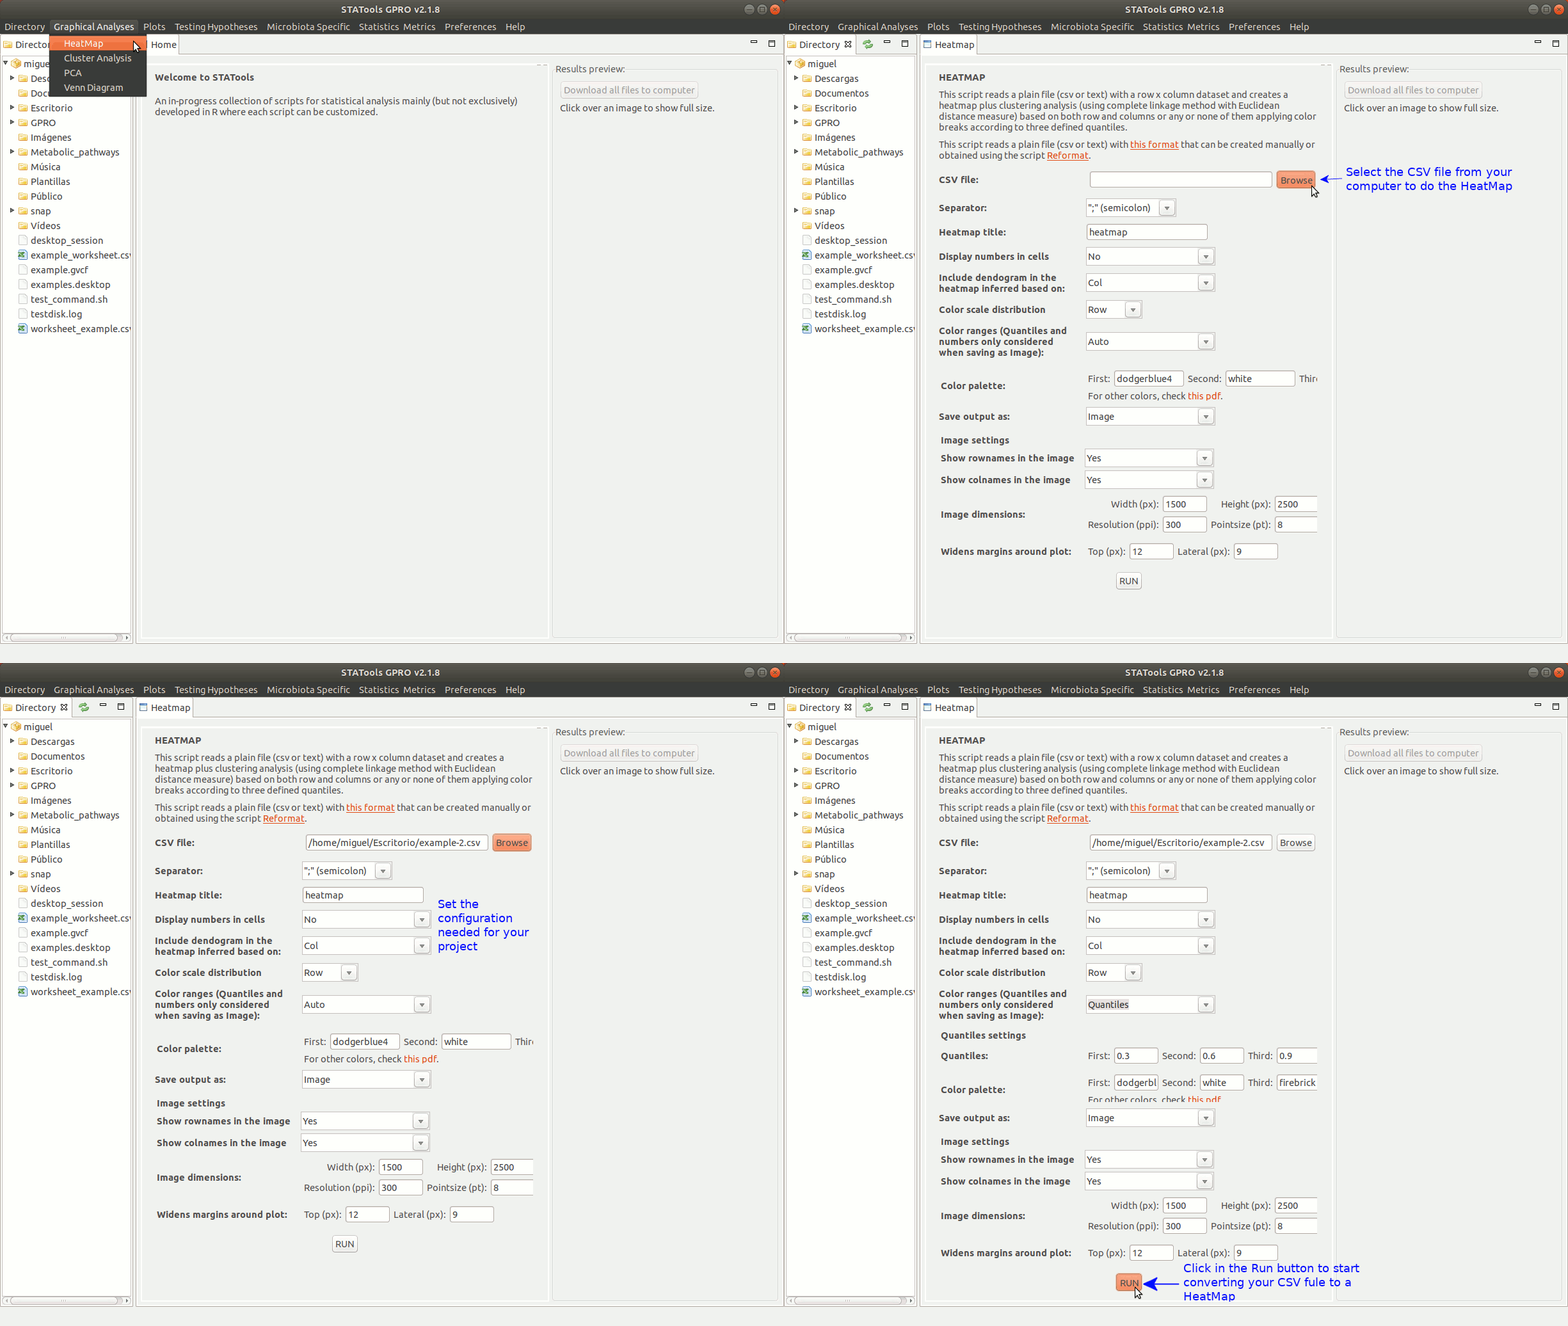
Figure 4: Animated GIF of an interface to create and visualize heatmap analyses.
In the below figure we show a graphical example of the input file accepted by STATtools to create a heatmap.
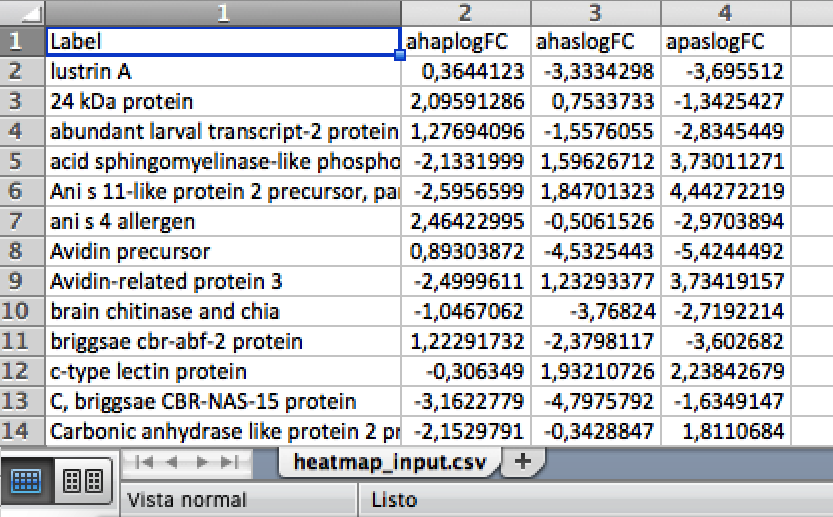
For other scripts, the organization of the data in columns and rows varies depending on the analysis. Each STATool interface presents a link of an example file for you to prepare the data for the specific script called by each specific interface.
